 New: SalesBlink is now in ChatGPT
Know what's working, or ask your agent
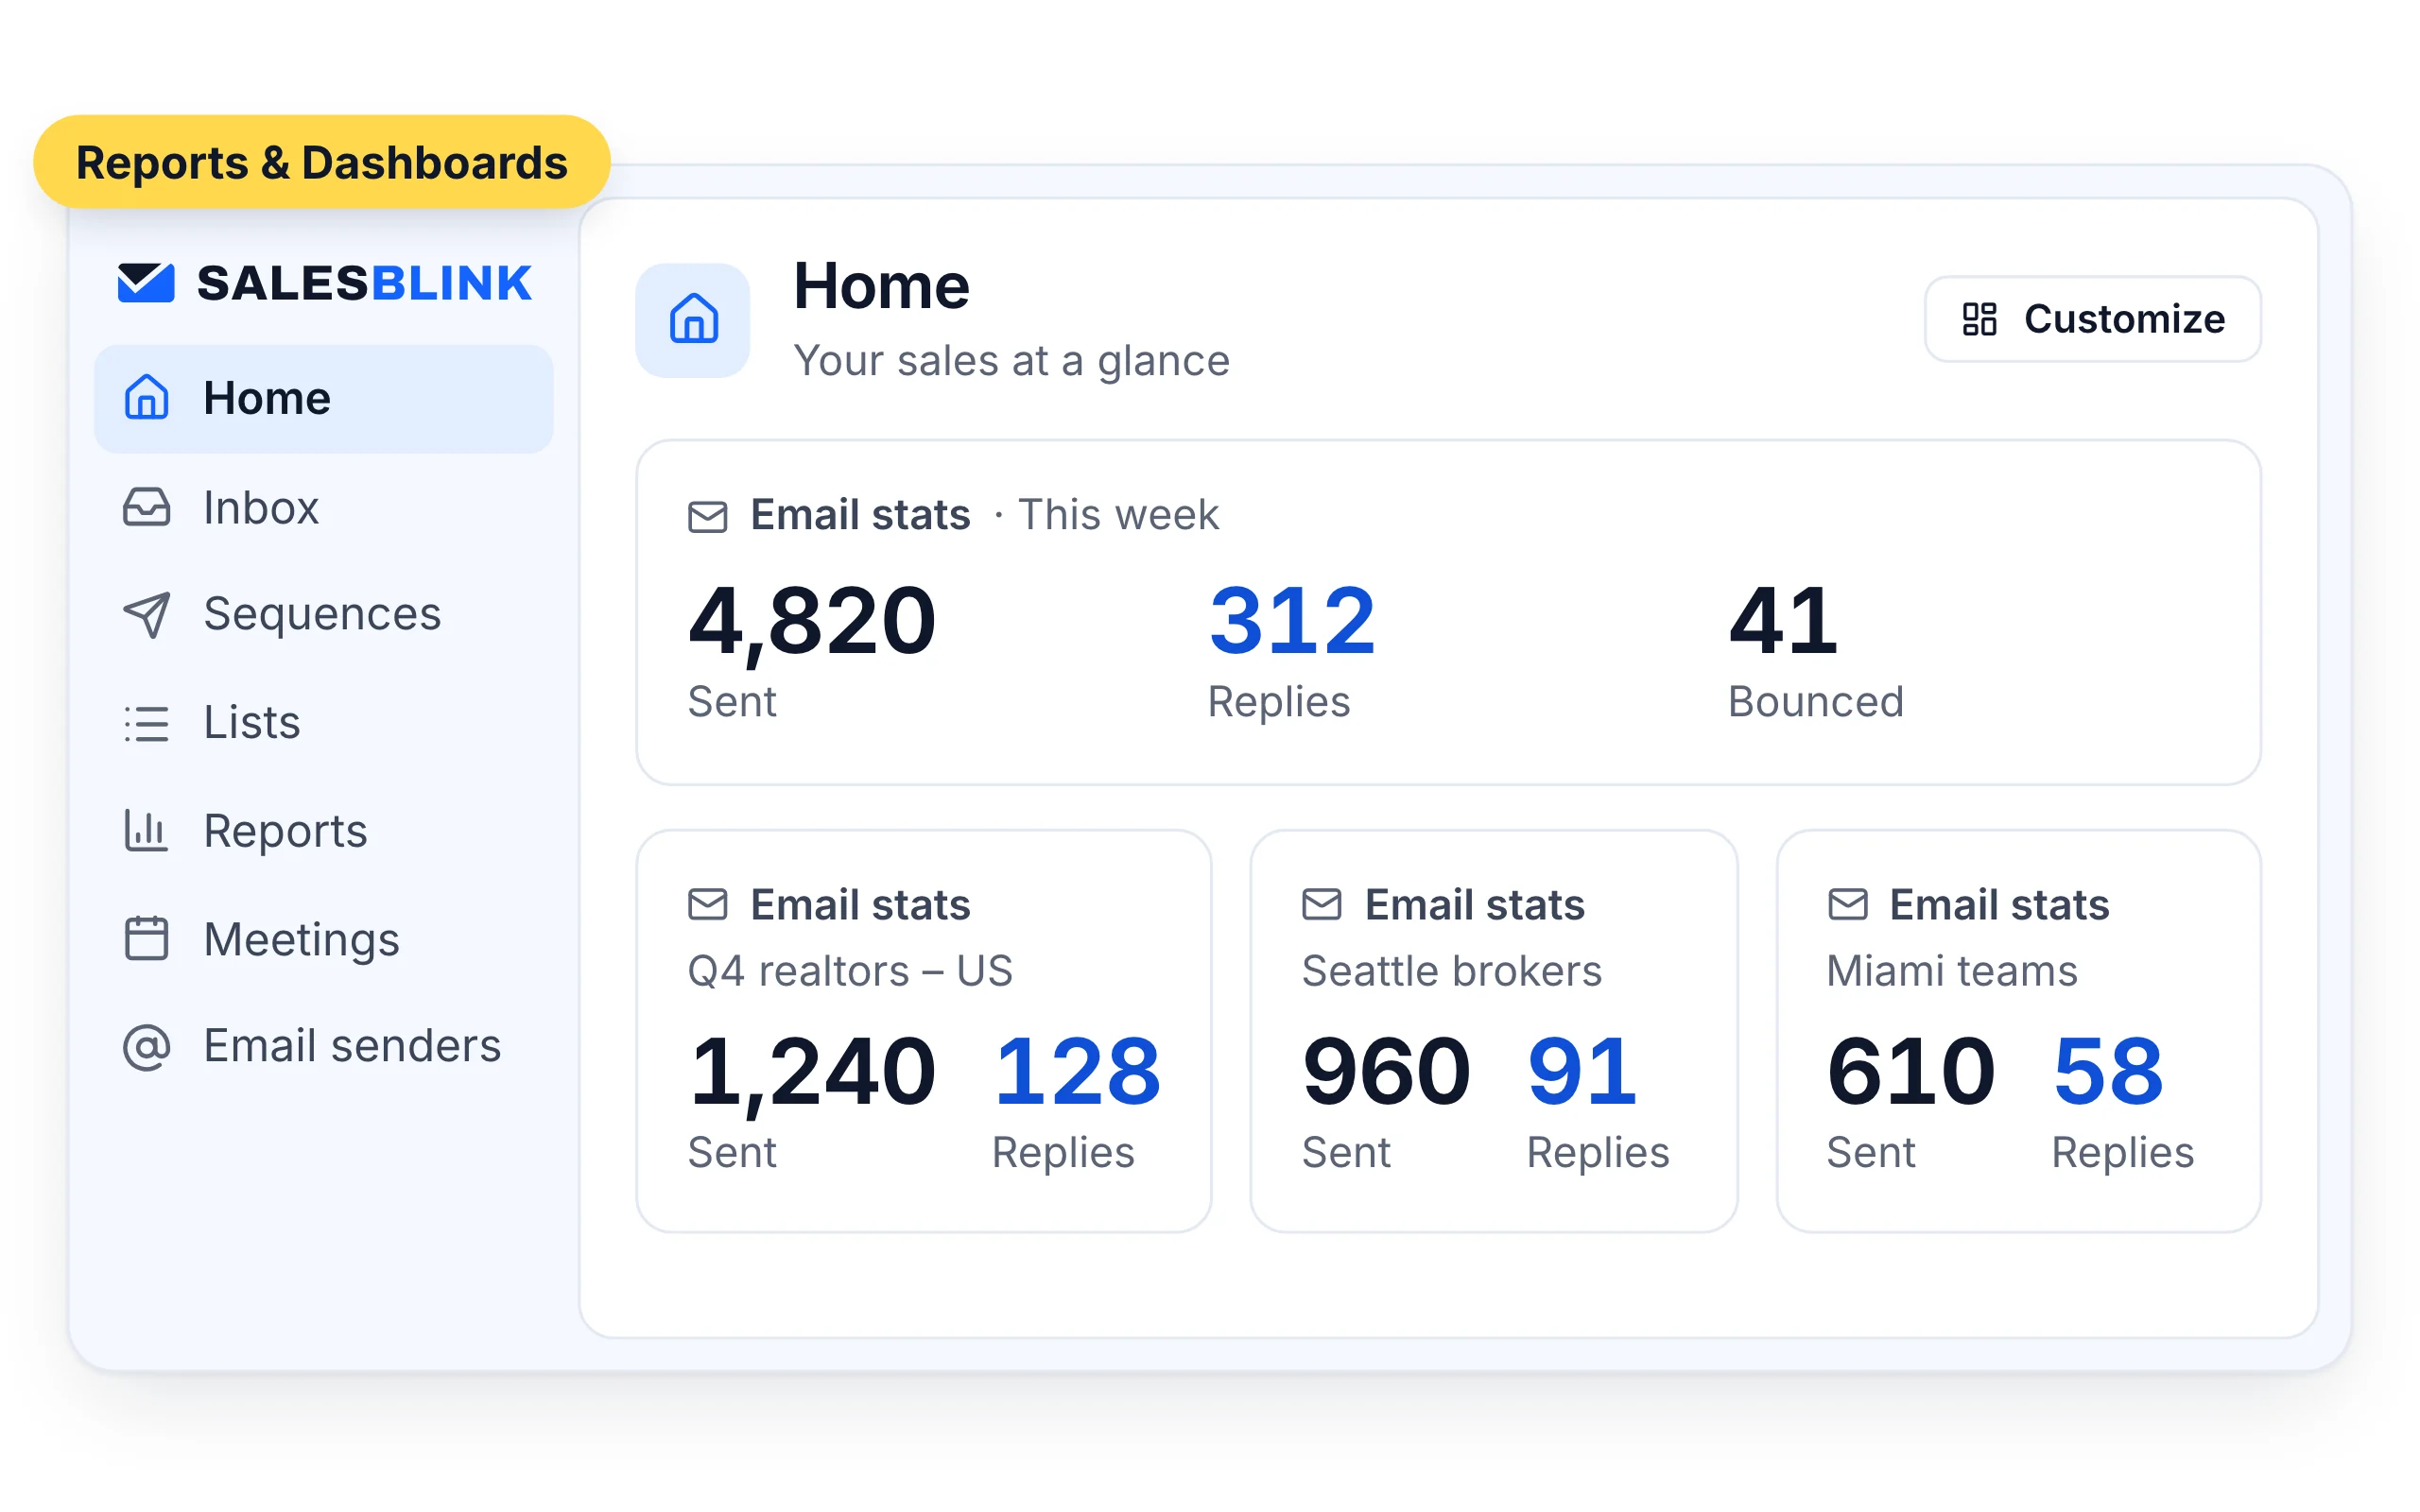
See how every sequence, step and mailbox performs, on dashboards you set up yourself.
14-day free trial. No credit card required.
Trusted by 12,000+ businesses


Dashboards you build
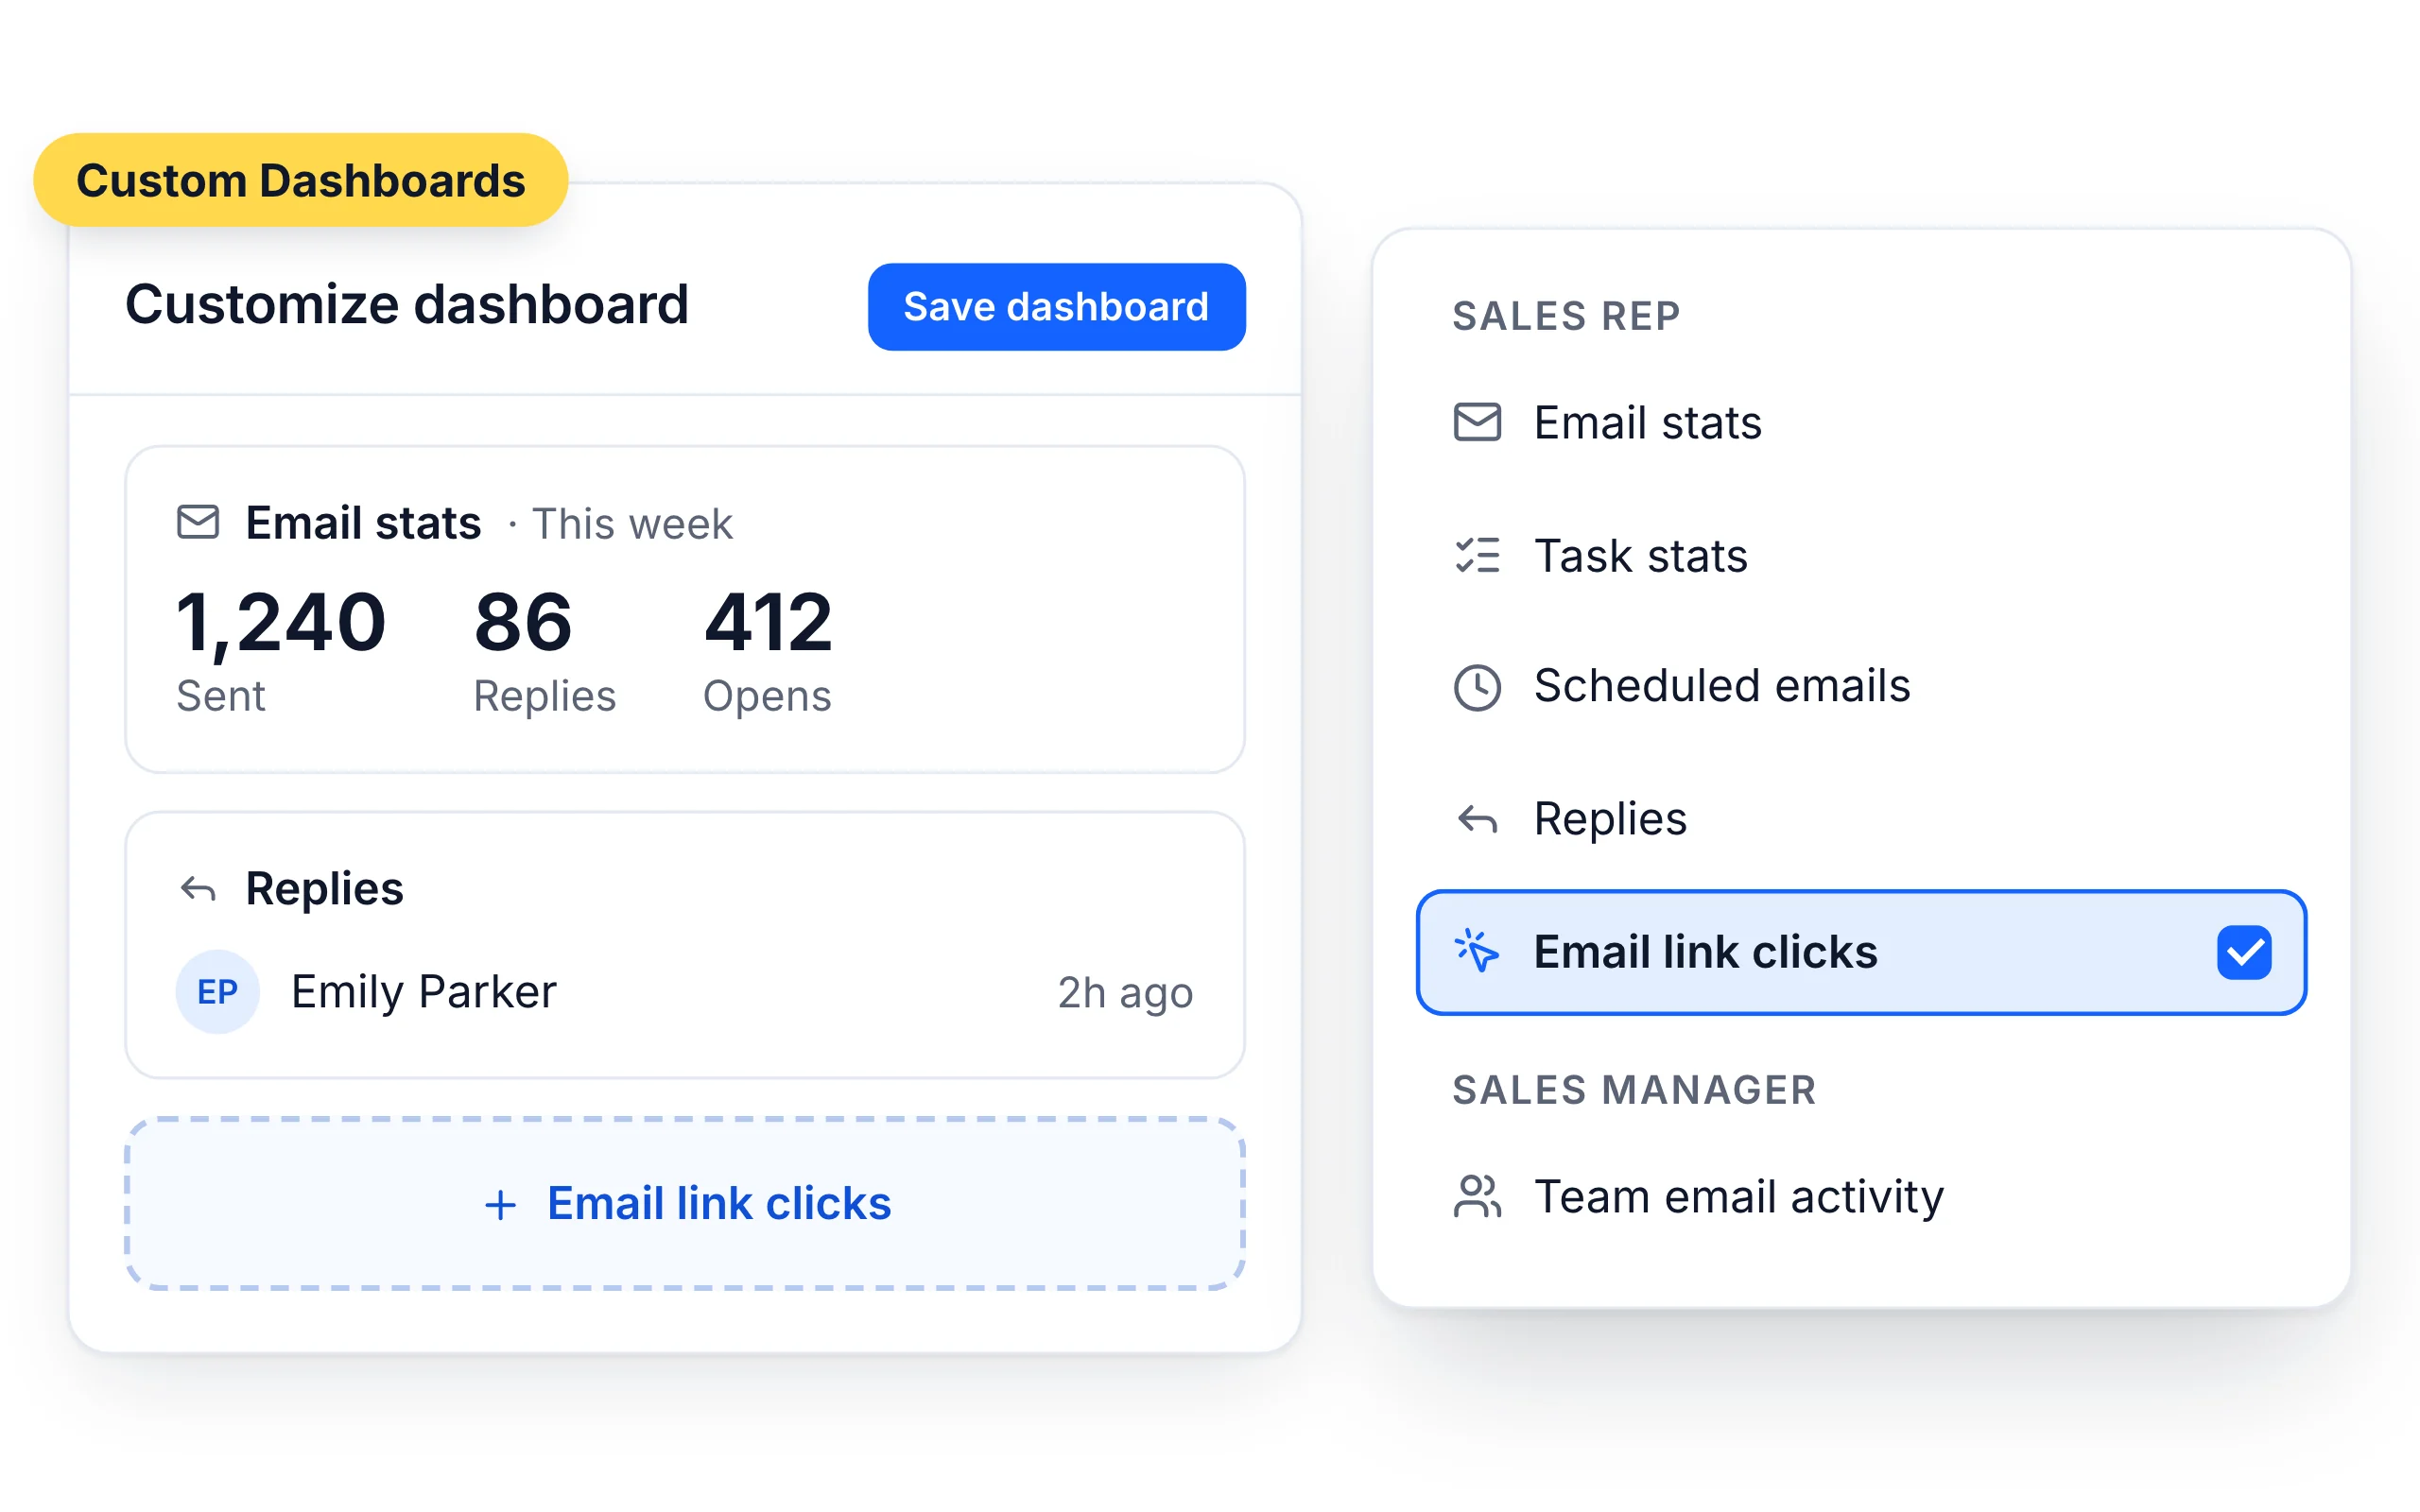
Add the cards you care about: email stats, task stats, scheduled emails, replies, opens and link clicks. Managers can add team cards.
Reports for every sequence and step
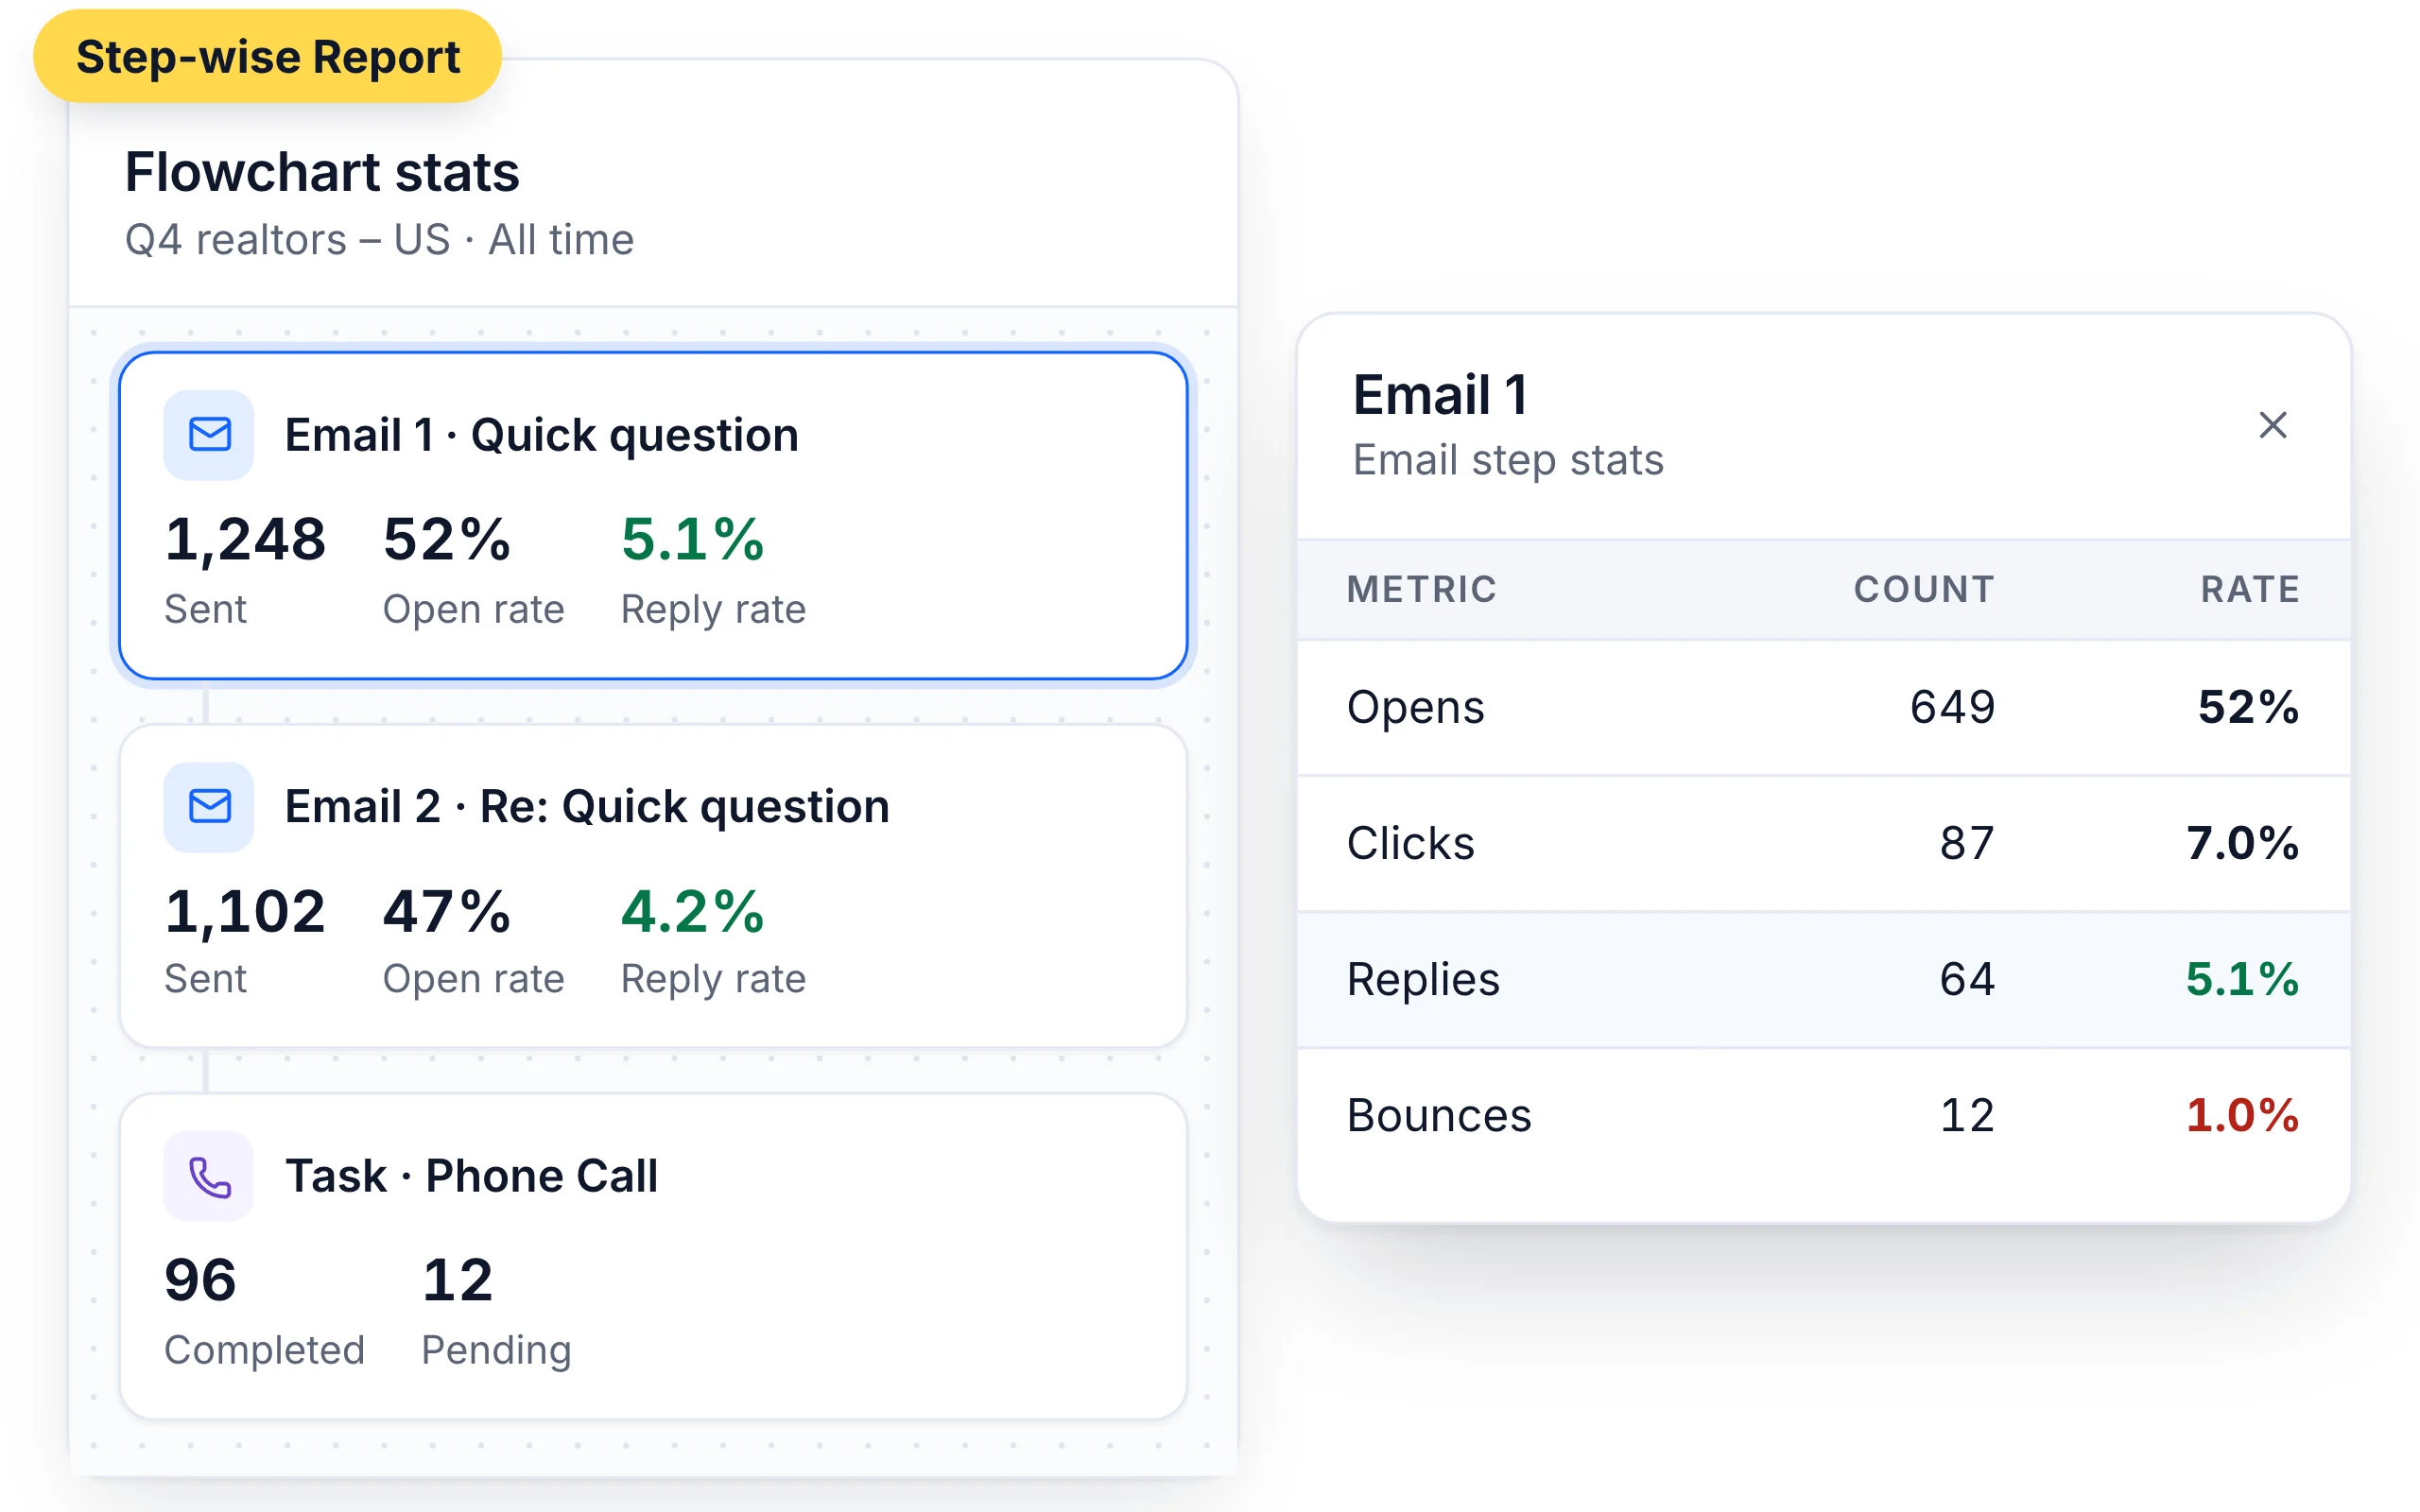
See leads, sent emails, replies, positive replies, opens, clicks, bounces and unsubscribes for each sequence, broken down by step and by mailbox.
Share results with your team or clients
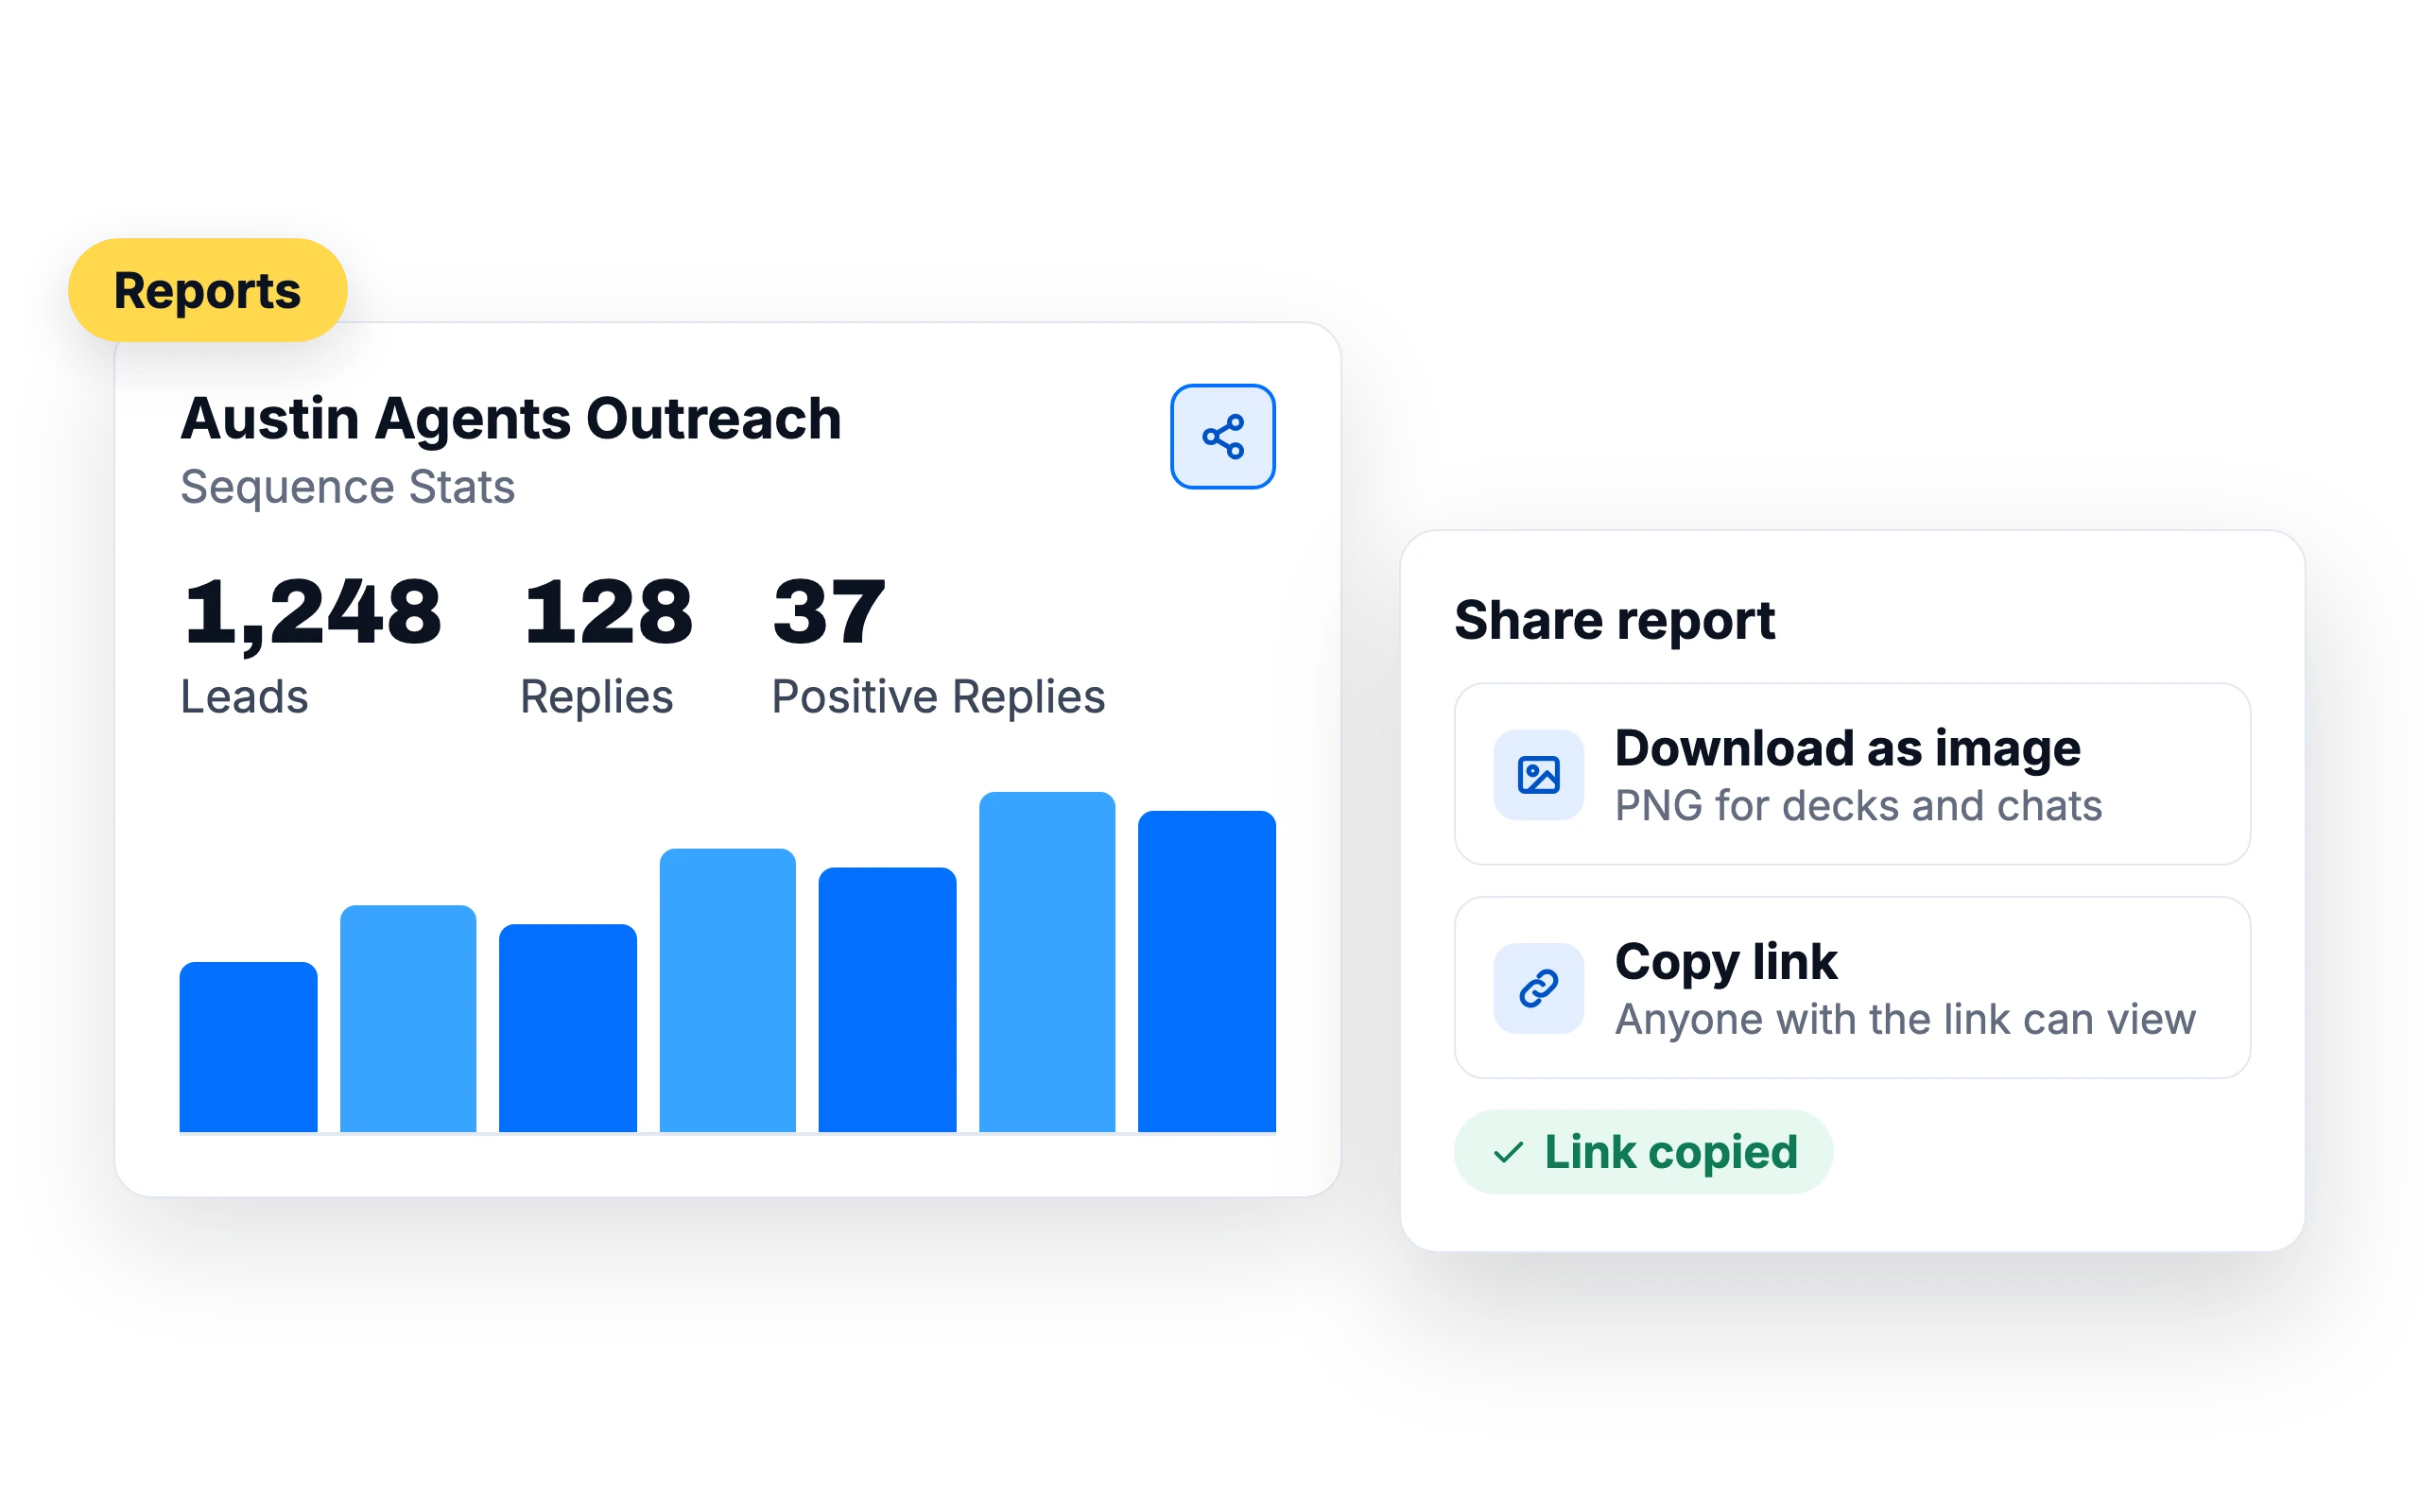
Download a sequence chart as an image to share it.
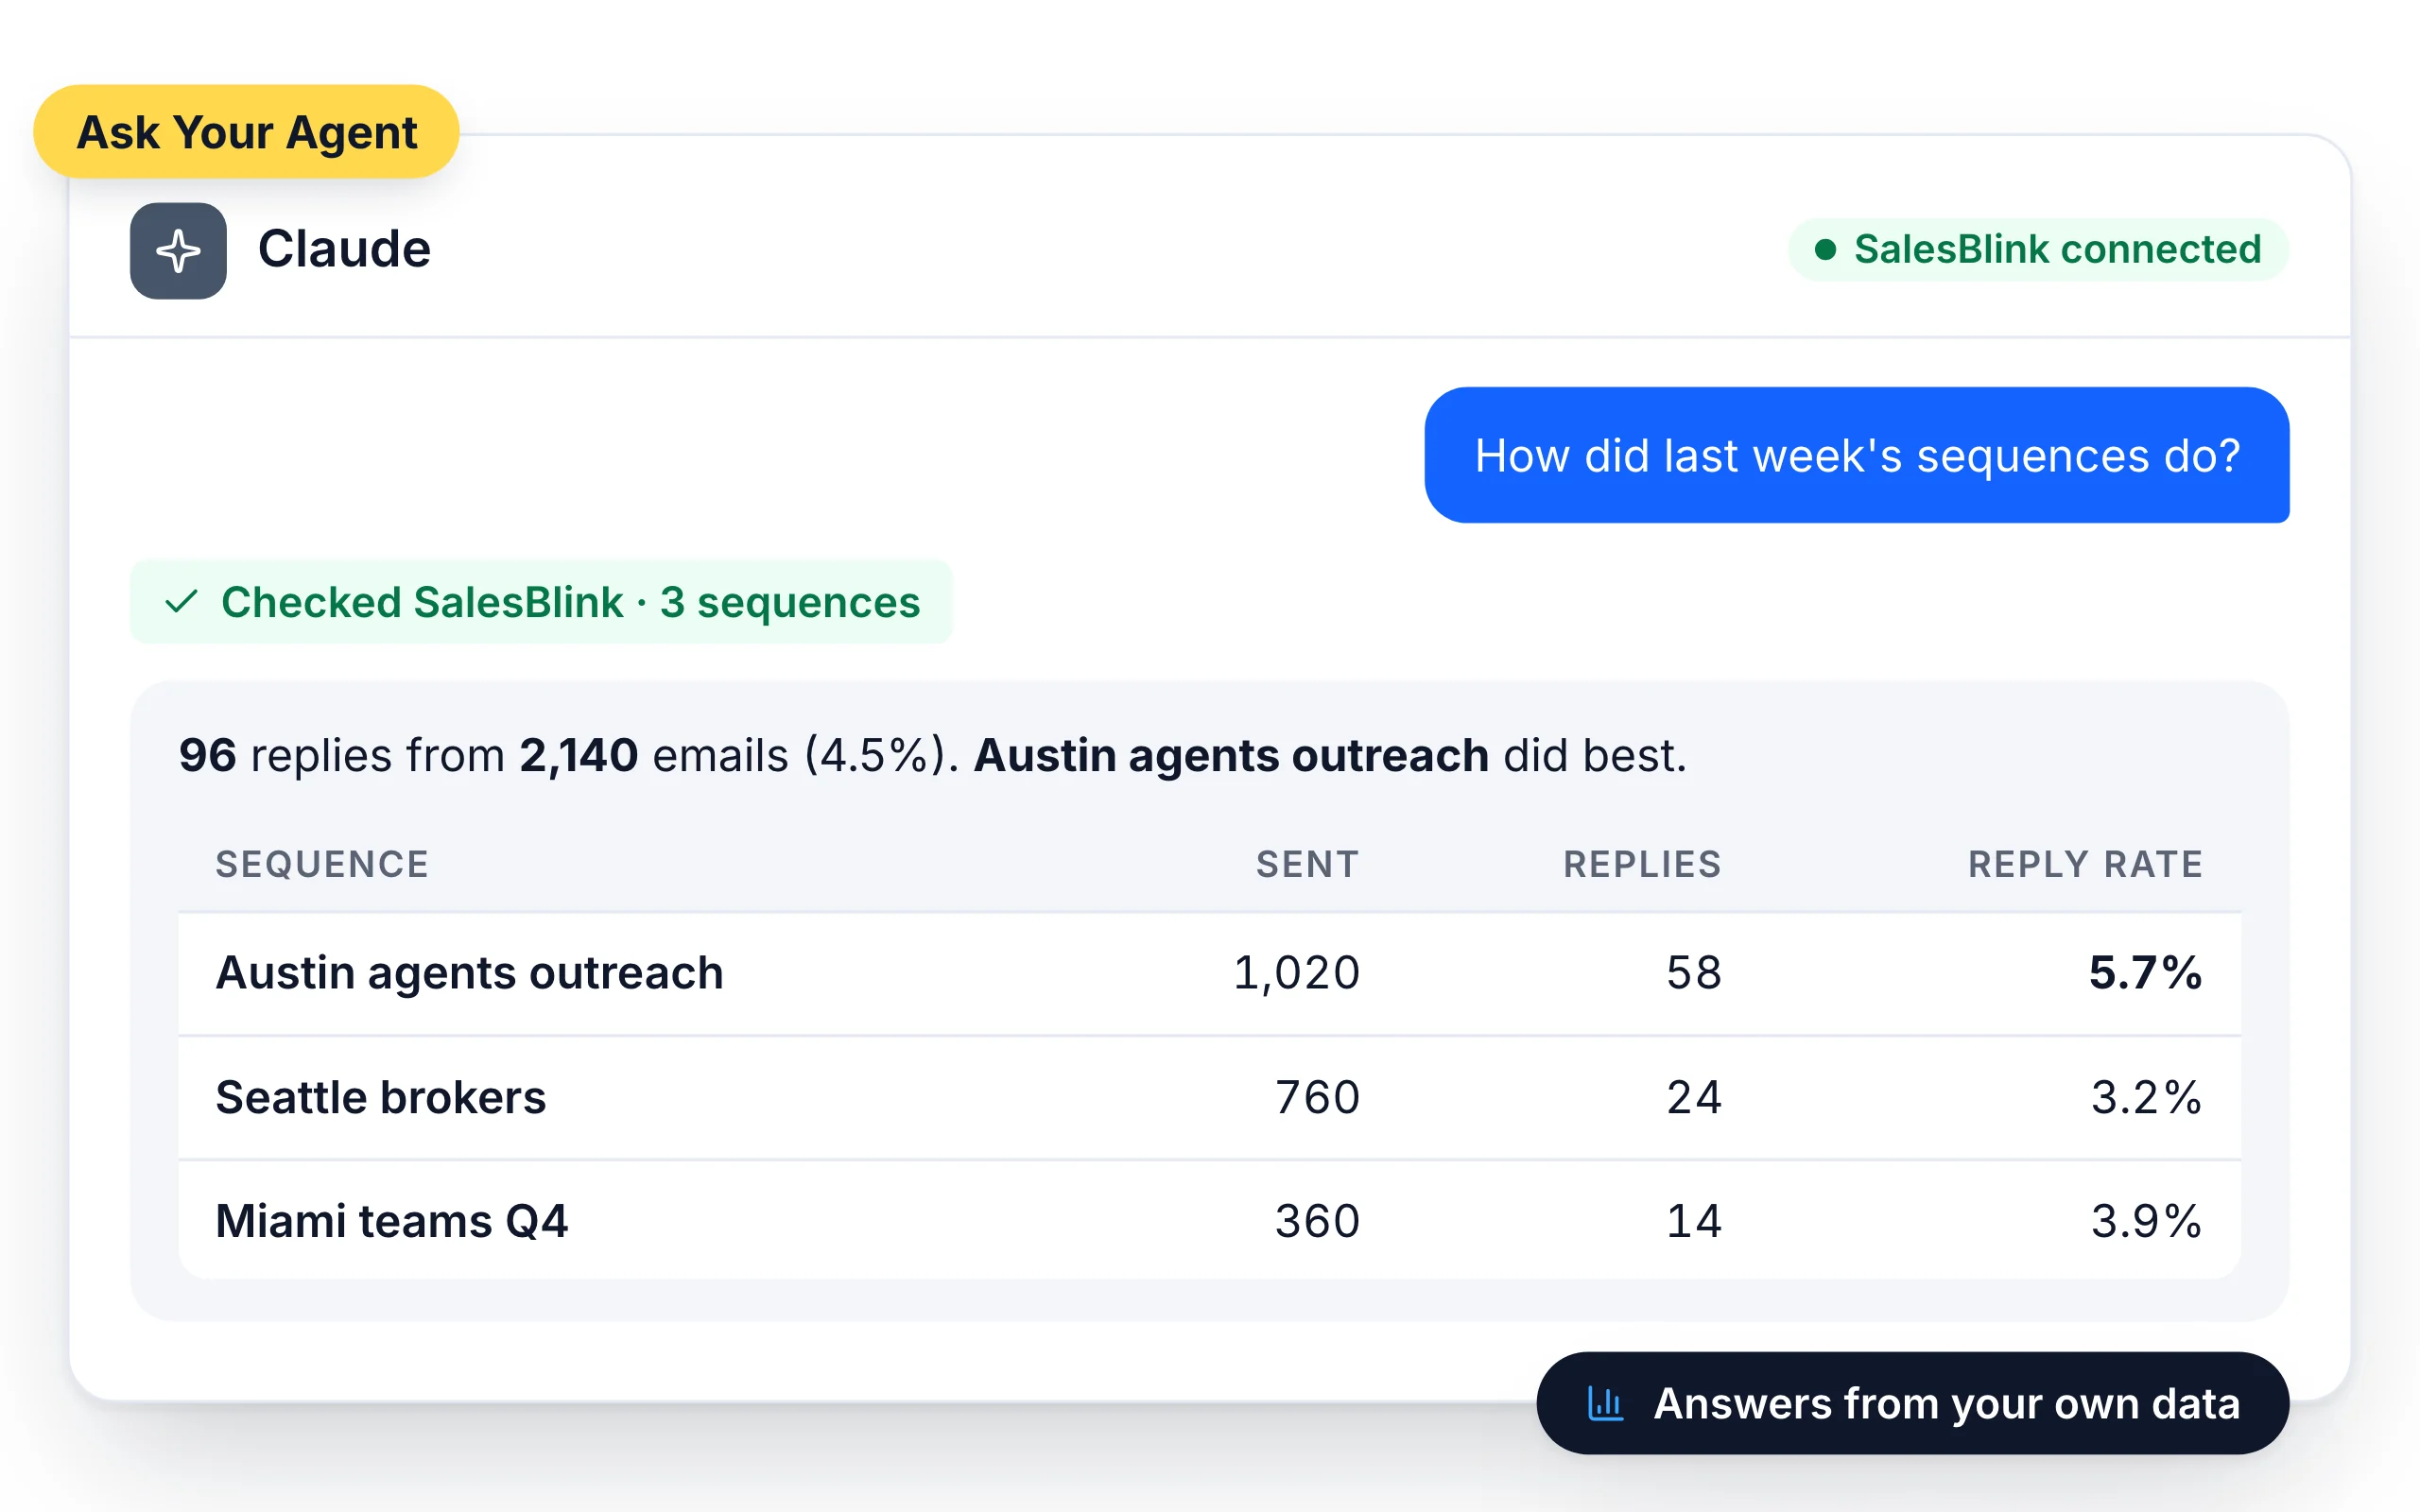
Ask for the numbers
Ask the SalesBlink AI Copilot or your own AI agent "How did last week's sequences do?" and get the answer from your data.
What customers say
4.7/5 on Capterra (286 reviews)4.5/5 on G2 (311 reviews)
5.0 on Capterra
“I especially enjoyed the in-depth analytics and reporting options it offers so that you can make adjustments based on actionable insights.”
Frequently Asked Questions
What stats can I add to Dashboard (Sales Manager)?
Add Team Email Activity and Team Member Sequence cards to see each team member's sent emails, opens, clicks, replies and sequences.
What stats can I add to Dashboard (Sales Rep)?
Add Email stats (sent, opens, clicks, replies, unsubscribes and bounces), Task stats, Scheduled emails, Replies, Opens and Email link clicks cards to your dashboard.
What reports are available?
As a sales rep, you can check reports of sent emails, opens, replies, bounces, clicks and unsubscribes. You can also add Task Stats to your dashboard.
Can clients see their reports?
Yes. Agencies can invite each client to their own workspace, where the client sees their campaigns, leads and reports.
Can I see every event for one lead?
Yes. Open Reports and go to the Logs view. Type the lead's email address in the Lead email filter and click Get logs. You can narrow the results by date range, sequence, step, mailbox and event, such as Email sent, Email opened, Link in email clicked, Email received a reply, Email bounced, Unsubscribed or Error.
Can I see how many emails will go out each day?
Yes. The Email Sending Schedule tab on the Reports page shows your email volume day by day. Use it to balance daily sending, spot mailboxes that have too much scheduled, and plan how many leads you can add. To see the queue for a single sequence, open its stats and check the Scheduled count, which shows the emails waiting to send.
Which time periods can dashboard cards show?
Email Stats, Team Email Activity and Team Member Particular Sequence Activity cards each have a View Type of This Week, Last Week, This Month or Last Month. You pick the metrics too: Sent, Outbox, Opens, Clicks, Replies, Unsubscribed and Bounced. Email Stats can cover all your sequences or one specific sequence. Drag cards to reorder them and click Done to save the layout.
Can I download results for each lead?
Yes. Open a list, select a sequence in the Sequence filter and click the download icon. The CSV then includes each lead's Lead Status and their Sent, Opens, Clicks, Replies, Bounces and Unsubscribed counts for that sequence, along with the Verification Status column. You can download only the leads that match your current filters, such as everyone marked Bounced.