
Top 22 Sales Metrics to Track for Maximum ROI
Have you ever wondered how businesses keep track of their success in selling? Enter sales metrics. These metrics, involving factors like the number of sales, the revenue generated, and customer satisfaction, act as your sales report card.
Are you curious to know if your organization is winning the sales game?
You have to use the metrics the right way. However, if you are new to the concept, you may need to learn how to proceed.
But don’t worry, we are there for you.
In this blog, we’ll show you which of the sales metrics you should measure to ensure your team stays on the path to success.
Table of Contents
- What Are Sales Metrics?
- Sales Metrics vs Sales KPIs
- Why Measure Sales Performance?
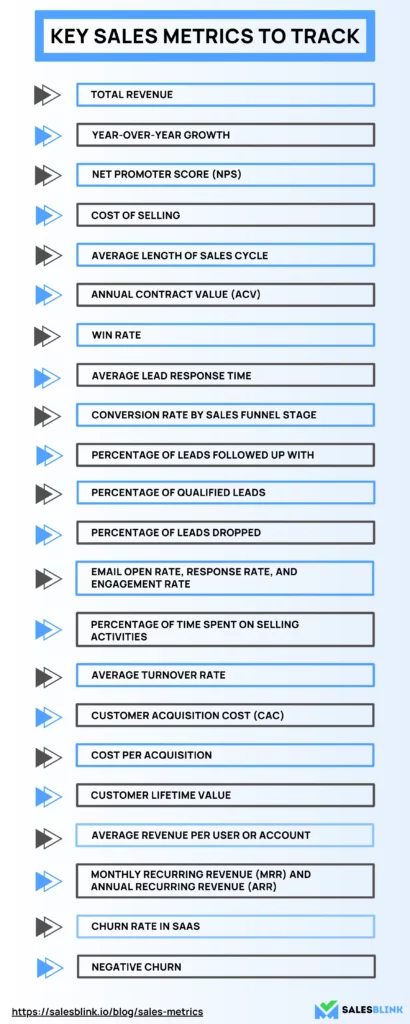
- Key Sales Metrics To Track
- 1. Total Revenue
- 2. Year-over-year growth
- 3. Net Promoter Score (NPS)
- 4. Cost of Selling
- 5. Average Length of Sales Cycle
- 6. Annual Contract Value (ACV)
- 7. Win Rate
- 8. Average Lead Response Time
- 9. Conversion Rate by Sales Funnel Stage
- 10. Percentage of Leads Followed Up With
- 11. Percentage of Leads Dropped
- 12. Percentage of Qualified Leads
- 13. Email Open Rate, Response Rate, and Engagement Rate
- 14. Percentage of Time Spent on Selling Activities
- 15. Average Turnover Rate
- 16. Customer Acquisition Cost (CAC)
- 17. Cost Per Acquisition
- 18. Customer Lifetime Value (LTV)
- 19. Average Revenue Per User or Account
- 20. Monthly Recurring Revenue (MRR) and Annual Recurring Revenue (ARR)
- 21. Churn Rate in SaaS
- 22. Negative Churn
- FAQs
What Are Sales Metrics?
Sales metrics are measurable indicators. They evaluate a company’s sales performance and effectiveness. Businesses use metrics to assess sales processes, strategies, and outcomes. This helps them make informed decisions and improvements.
Sales metrics are like scorecards for businesses to see how well they’re selling stuff. They include things like counting how many sales are made, how much money comes in from those sales, and checking if customers are happy. It’s a way of keeping track of how well the business is doing in the sales game.
Think of sales metrics as real standards that shine a light on different parts of your sales efforts. They’re like a guide for companies, helping them navigate through the complicated world of market dynamics and customer behavior. By carefully looking at this data, you can understand your team’s strengths and areas where they can get better.
Using data to make decisions helps businesses fine-tune their sales strategy. Sales metrics don’t just show what’s happening; they actually steer businesses toward growing steadily in a world where numbers matter.
Sales Metrics vs Sales KPIs
Sales metrics and key performance indicators (KPIs) play different roles in business analytics, but they work together to evaluate how well sales are going. Sales metrics, like revenue and conversion rates, give a detailed view of sales activities. When aligned with KPIs, their real power shows.
KPIs act as guideposts, connecting raw data to organizational goals. Combining sales analytics with KPIs helps businesses track progress toward big objectives and make informed decisions.
This teamwork turns numbers into practical steps that match what the company wants. Understanding this partnership improves business plans. It helps sales teams follow the company’s goals, turning confusing charts into smart projects. Basically, linking sales numbers to goals helps companies have one clear strategy, making things work better for long-term success.
Why Measure Sales Performance?
Following are the reasons why it is important to measure Sales Performance:
1. Critical Sales Metrics
Measuring sales success goes beyond everyday practices; it is a crucial practice. This involves examining key indicators such as conversion rates, sales cycle duration, and churn rates. These metrics serve as essential gauges, offering insights into the performance and health of sales efforts. Understanding and tracking these factors are essential for businesses aiming to navigate the competitive landscape and optimize their strategies for sustained success.
2. Insights into Customer Interactions
Metrics serve as windows providing insights into client interactions, offering valuable information crucial for refining sales techniques. By looking at key indicators like conversion rates, sales cycle duration, and churn rates, businesses gain a deeper understanding of the customer journey. This enables them to adapt and optimize strategies, ensuring a more effective and customer-centric approach. In essence, these metrics act as a guiding light, illuminating areas for improvement and paving the way for enhanced sales practices in the competitive business landscape.
3. Adapting Strategies with Data
Adaptability is key in the dynamic landscape of sales. By delving into detailed metrics, teams can identify shifts in customer demands and preferences, allowing for swift and responsive modifications. This approach ensures that businesses remain flexible, readily adapting to evolving market conditions and customer expectations.
4. Enhanced Team Productivity and Revenue
Implementing a data-driven strategy has a dual impact on the business landscape. Firstly, it enhances individual productivity by providing insights and actionable information derived from thorough analysis. Secondly, it builds a collaborative environment for the sales team.
Key Sales Metrics To Track
The following are the key sales metrics:
1. Total Revenue
Total revenue is the most important sales indicator, acting as the foundation upon which a company’s financial success is based.
This indicator captures a sales team’s combined effort, talent, and strategy in addition to just reflecting financial benefits.
Monitoring overall revenue is similar to keeping an eye on a company’s heartbeat; it beats with life and shows how well sales operations are doing. Examining their overall revenue allows you to gain a comprehensive insight into your market influence, product appeal, and how consumers respond to their offerings.
2. Year-over-year growth
Year-over-year growth, also referred to as YoY, is a key indicator of how well a firm is doing. It calculates the percentage change in important metrics from one financial year to the next over a certain time frame.
YoY growth gives a long-term perspective and shows whether a company continually outperforms its prior standards. Positive YoY growth denotes progress, growth, and market durability.
It displays a company’s long-term growth path in addition to its recent triumphs. Negative YoY growth, on the other hand, causes reflection and calls for strategic changes to buck the trend.
For stakeholders, investors, and executives, this metric is crucial since it provides a concrete indicator of how a company has changed over time.
3. Net Promoter Score (NPS)
NPS is a measure that explores the world of customer loyalty and opinion. It assesses the chance that customers would advocate for a business’s goods or services to others.
Customers are divided into Promoters (loyal enthusiasts), Passives (satisfied but unenthusiastic customers), and Detractors (unhappy customers), according to NPS’s simple concept.
Businesses determine their Net Promoter Score by deducting the percentage of Detractors from the rate of Promoters. A high NPS reflects solid client relationships, good customer satisfaction, and favorable word-of-mouth.
NPS surveys offer useful information that firms can use to pinpoint problem areas, improve customer experiences, and increase customer loyalty. This number explores emotional connection and customer advocacy. These go beyond transactional encounters.
4. Cost of Selling
The main measure of selling cost shows the money spent on sales activities. The expenses include the wages of the sales force. They also welcome commissions, marketing supplies, travel, and technological equipment.
To be effective and cost-effective, sales techniques must understand selling costs. An imbalance between revenue and expenses can undermine earnings. To avoid this metric, you need careful research. Businesses can identify areas of inefficiency, optimize resource allocation, and raise the return on investment (ROI) of sales activities by breaking down the components of the cost of selling.
Additionally, this indicator helps plan your budgets, allowing you to distribute resources wisely and maximize the impact of your sales initiatives.
5. Average Length of Sales Cycle

The average length of the sales cycle breaks down the time between lead generation and transaction close. It denotes the length of time it takes for a sale to develop, representing the complex process from potential customers’ first curiosity to eventual conversion.
For effective pipeline management, you need to examine the typical sales cycle. A lengthy sales cycle may indicate a number of difficulties, including difficult decision-making processes, hesitant customers, or pressure from the competition.
A shorter sales cycle, on the other hand, indicates simplified procedures, persuasive selling methods, and successful relationship-building.
By understanding the factors that impact the duration of the sales cycle, you can introduce targeted strategies to accelerate sales processes, enhance customer engagement, and increase revenue generation.
6. Annual Contract Value (ACV)
ACV delves into how much money a customer generates within a year. The metric reveals the financial impact of client interactions. Planned account management is linked to it. Businesses can evaluate the profitability of individual accounts thanks to the insight offered by ACV. ACV is a strong indicator of profitable, long-term relationships and a mutual value exchange between the business and the client.
On the other hand, a low ACV may call for reevaluating the account strategy and placing more of an emphasis on upselling and cross-selling, or maintaining the relationship in order to increase its financial sustainability.
This metric makes targeted account-based marketing possible, pointing companies in the direction of high-value clients and maximizing income streams.
7. Win Rate
The ratio of deals closed as compared to all opportunities explored is measured by the win rate, which is given as a percentage. It is a metric that captures the success of sales activities by demonstrating the team’s capacity to convert leads into customers successfully.
A high win rate indicates effective sales strategies, as well as a deep understanding of customer needs and competitive positioning. It is a metric that evaluates the effectiveness of the sales team by showing their aptitude for overcoming barriers, striking deals, and obtaining commitments from clients.
You may discover bottlenecks, improve sales techniques, and increase overall performance by analyzing win rates at various phases of the sales funnel since it offers detailed information.
8. Average Lead Response Time
Lead response time, or speed to lead, measures how quickly you respond to potential customers. It is the time between their initial contact and your follow-up. Typically, many businesses need more speed to lead.
Forbes reports that the average lead response time is approximately 47 hours. This suggests a significant delay in responsiveness. Not only does prompt lead response demonstrate efficiency, but it also influences client satisfaction.
A slow response might cost businesses opportunities since clients may go to rivals who can respond more quickly. Companies may take advantage of new leads, develop customer connections, and build a solid reputation for good customer service by reducing lead response times.
This measure emphasizes how critical timely communication is in a competitive environment.
9. Conversion Rate by Sales Funnel Stage
Conversion rates measure the transition of potential customers between sales funnel stages. The sales funnel represents the customer’s journey from awareness to purchase. The funnel has stages. Each stage shows customer engagement or commitment. The stages could be awareness, interest, consideration, intent, and purchase.
The conversion rate measures how many people progress through each stage. You can analyze these rates to identify potential areas for improvement or optimization. This analysis helps enhance overall conversion rates and maximize sales.
10. Percentage of Leads Followed Up With
The proportion of leads that are followed up on is an essential indicator because no potential information should be ignored. It illustrates how effectively a sales team works to develop leaders and turn casual inquiries into significant engagements.
Effective lead nurturing takes into consideration both number and quality.
This metric emphasizes the value of automated follow-up procedures and methodical follow-up processes.
A high percentage of leads that are followed up reflect aggressive sales efforts that maximize each lead’s potential and raise the possibility of successful conversions.
11. Percentage of Leads Dropped
Although it’s important to follow up on leads, not all of them are worth the effort. A measure that examines leads considered inappropriate for further follow up is the percentage of leads discarded.
Understanding the causes of lead disqualification—which can range from mismatched needs to budget constraints—can be done by analyzing this measure.
Teams might improve their strategy by understanding the reasons why specific leads are lost. In order to ensure that sales efforts are concentrated on leads with the highest likelihood of conversion, it enables the improvement of targeting criteria.
You can use this measure to use resources wisely, spending time and energy on leads that fit your desired customer profiles.
12. Percentage of Qualified Leads
A key component of effective sales operations is the identification of high-potential prospects. The proportion of leads matching particular requirements and falling inside the ideal customer profile is indicated by the qualified lead percentage.
By focusing resources on prospects who have a sincere interest in the provided goods or services, this metric optimizes sales efforts.
Qualified leads indicate a better likelihood of conversion, which cuts down on the time the sales reps must spend on ineffective activities.
You can improve the quality of your sales pipeline, increase conversion rates, and concentrate on cultivating connections that have a higher chance of leading to profitable deals by optimizing the lead qualification criteria.
13. Email Open Rate, Response Rate, and Engagement Rate
The percentage of receivers that actually opened an email is known as the email open rate, and it reflects how appealing the subject line is and how effective the content is.
The percentage of receivers that responded to the email is known as the response rate, and it illustrates how well the call to action worked.
The engagement rate includes all of the email’s engagements, including link clicks, downloads, and social media sharing.
These metrics provide information on the effectiveness of the email campaign, allowing companies to assess recipient interest, improve content strategies, and improve communication techniques.
You can modify your email campaigns for optimum impact, encouraging meaningful engagements and successfully nurturing leads by analyzing these KPIs.
14. Percentage of Time Spent on Selling Activities
A key element in sales productivity is time management. The proportion of time spent on selling activities indicates how much of a sales team’s time is spent on activities that generate income.
It includes tasks including client consultations, talks, discussions, and follow-ups. You may increase productivity, maximize client contacts, and increase sales possibilities by making the best use of your time allocation.
You can review the impact of non-revenue-generating tasks and look into automation or outsourcing solutions.
You can increase sales efforts, streamline workflows, and work more effectively by making sure that sales reps spend the bulk of their time engaging in sales-related tasks.
15. Average Turnover Rate
Maintaining consistent customer interactions relies heavily on team stability. The turnover rate shows how many employees leave the sales team. It’s often given as a percentage within a specific timeframe. High turnover rates can cause service quality inconsistencies, affecting client experiences. This can disrupt customer relationships.
Understanding turnover causes is crucial. Some causes include inadequate training, insufficient support, and improper job assignments. Addressing these issues can improve team stability. It can also boost employee satisfaction and strengthen customer relationships. A low turnover rate indicates a stable and satisfied workforce. This creates a foundation for long-term client engagement and fuels relationship development.
16. Customer Acquisition Cost (CAC)
Costs associated with acquiring new customers make the customer acquisition cost an essential factor in financial planning.
The CAC calculates the overall cost of acquiring a new customer, which includes marketing expenses, sales force costs, advertising costs, and promotional prices.
Planning a budget requires an understanding of CAC, which enables companies to evaluate the efficacy of their client acquisition efforts. You can measure whether your client acquisition efforts are sustainable by comparing CAC with customer lifetime value (LTV).
A high CAC in comparison to LTV shows the need for strategic changes, such as improving sales strategies, audience refinement, or channel optimization.
By enabling you to make data-driven decisions, this metric helps match client acquisition methods with your financial goals and overall profitability.
17. Cost Per Acquisition
Cost per acquisition (CPA) is a useful number linked to cost per acquisition (CAC) that helps understand the expenses of getting new clients. While CPA looks at specific ads or ways of reaching people, CAC gives a big picture of all acquisition costs. By figuring out the CPA for different marketing efforts, businesses can see which ones work best and cost the least.
18. Customer Lifetime Value (LTV)
Customer lifetime value (LTV) is a number that estimates how much money a customer will bring to a company over time. It looks at the overall financial impact of a customer, not just their first purchase. Things like repeat buying, additional sales, and loyalty programs are all part of LTV.
Understanding LTV is crucial for smart decision-making. It helps focus on keeping customers, figuring out prices, and deciding where to invest in customer relationship programs. By improving the customer experience, making connections, and providing great post-sales support, you can increase LTV. This means more income and turning one-time buyers into loyal, long-term customers. LTV shows how well a company can build lasting connections with its customers.
19. Average Revenue Per User or Account
The average money earned from one customer or account is shown by metrics like Average Revenue Per User (ARPU) or Average Revenue Per Account. This helps set prices, plan subscriptions, and run campaigns to sell more.
With ARPU, you can see how each type of customer affects your money. Then, they can change prices and services to match. By keeping an eye on ARPU, you can find valuable customer groups, improve costs, and run targeted campaigns to sell more. Knowing the money earned per user or account helps target customers better, adjust marketing plans, and make products that match what customers want. This makes sure each type of customer brings in as much money as possible.
20. Monthly Recurring Revenue (MRR) and Annual Recurring Revenue (ARR)
Monthly recurring revenue (MRR) and annual recurring revenue (ARR) measurements are essential since subscription-based products or services frequently use regular revenue models.
MRR is a measure of the consistent monthly income from subscription services that provides stability and financial predictability. ARR gives an increased understanding of recurring revenue sources by extending this idea to an annual timeframe.
These indicators provide information on the viability of subscription models and are crucial for planning financial stability and growth. You can evaluate the scalability of your subscription services, improve pricing strategies, and spot loss of client trends by tracking MRR and ARR.
These indicators help make data-driven decisions, improve customer experiences, subscription offerings, and handle customer retention issues.
21. Churn Rate in SaaS
The churn rate measures how fast customers stop using a company’s services, especially in Software as a Service (SaaS) businesses. Subscription-based models must keep customers, so the churn rate is a big deal. If lots of customers leave, the service isn’t great, people aren’t loyal, or there’s tough competition.
By looking at turnover rates, businesses can figure out what customers want, improve service, and make products better. Fixing why customers leave can help companies keep clients, boost long-term money, and complete customer relationships. In SaaS, the churn rate is super important—it guides plans to keep customers and ensures subscription-based businesses keep succeeding.
22. Negative Churn
Negative churn is like a high-five for a business—it means making more money from existing customers over time. This happens when customers not only stick around but also spend more. It’s a sign that the business is doing a great job at keeping customers happy and finding ways to sell more to them.
Encouraging negative churn is like building a strong base for making more money. It shows that the business is flexible, cares about what customers want, and is committed to long-lasting relationships. So, it’s not just about keeping customers; it’s about keeping them happy and growing together for the long haul.
Use Sales Metrics To Increase Sales Performance
Understanding and using data for your sales performance can make a big difference. By looking at conversion rates, you can guide your team toward leads that are more likely to bring in sales. This helps you focus your efforts better. Quick follow-ups simplify things and boost customer engagement, laying the groundwork for lasting connections by keeping an eye on how long it takes to close a sale.
Using metrics like Annual Contract Value (ACV) gives you insights into managing important customer accounts and building long-term relationships. Responding fast to leads and improving communication makes customers happier and more loyal, building trust.
Checking your turnover rate helps you understand how to keep employees and protect your income from potential losses.
Each metric is a step toward successful sales if you analyze it correctly. These insights help you make smart choices, refine your strategies, and build lasting relationships with clients, making your sales efforts not just effective but also transformative in the ever-changing business world.
Don’t forget to thank us later for the inputs!
FAQs
By comparing the output to input, sales productivity indicators assess the effectiveness of sales teams, assuring optimal resource use and improved outcomes.
Sales metrics offer practical information that may be utilized to direct targeted efforts, improve client interactions, and support data-driven plans, all of which boost sales performance.
The most important sales metrics vary depending on the company’s objectives but often include conversion rates, customer lifetime value, churn rates, and average revenue per user. These metrics offer crucial information about the state of sales and its potential for expansion.